Growth Intelligence
Most company databases tell you what a company does. This one tells you whether it is expanding, contracting, or standing still, and how fast, tracked at the company-year level over time.
Detect growth momentum and early contraction signals before they become visible in financials, using multi-year workforce data built on observed records up to 2020.
Screen entire markets by workforce growth velocity across multiple years. Spot hiring momentum or early contraction before it shows up in earnings.
Foundation
Data Scale
~48.7M
Company-year records
19
Structured columns
4.2M
Companies tracked
1950–2020
Time range
US+
Primary coverage
Pre-built
Percentiles & flags
Observed data gets enriched with current headcount, skills, capabilities, and financial information
Overview
What It Is
Company-level workforce expansion and contraction measured at the company-year level in absolute and percentage terms, with multi-year hiring momentum distinguishing sustained growth from single-year spikes. This longitudinal dataset focuses on the 1950–2020 period, where company coverage and signal density are highest.
Pre-computed growth percentiles across overall, industry, and size-cohort benchmarks, paired with average employee tenure as a signal of retention quality and organizational stability over time.
Pre-computed growth tiers ranging from rapid contraction to hyper growth, structured as temporal sequences ready for filtering and direct integration into scoring or segmentation workflows.
Capabilities
What You Can Do With It
Rank every company in a target market by workforce growth rate over time and build a pipeline from the top down
Detect early contraction signals in a portfolio company two to three quarters before revenue decline becomes visible using multi-year workforce trends
Compare multi-year growth velocity across competitors in the same sector, size cohort, or geography
Integrate temporal workforce growth signals into scoring models to prioritize accounts demonstrating sustained scaling
Signals
What's Included
Observed headcount at company-year level
Net headcount change (absolute and percentage)
Year-over-year growth rate
Average employee tenure
Growth segmentation bucket (five-tier classification)
Growth percentiles (overall, within industry, within size cohort)
Directional flags: resilience, high resilience, decline
Format: CSV, Parquet, Snowflake, or RAG file. Company-year level. One row per company per year. Structured for BI tools, CRM enrichment, or direct integration into analytical and AI pipelines requiring temporal company data.
Preview
Dataset Preview
A representative sample of company-year signals from the dataset. Production versions include additional fields, temporal depth, and filtering capabilities.
| Company | Industry | Country | Headcount | Net Growth | Growth % | Percentile |
|---|---|---|---|---|---|---|
| equitable | real estate | United States | 697 | +320 | 84.9% | 100 |
| blue yonder gmbh | IT services | Germany | 373 | +139 | 59.4% | 99.7 |
| brex | financial services | United States | 281 | +82 | 41.2% | 99.3 |
| celonis | IT services | Germany | 201 | +47 | 30.5% | 99.0 |
| arcadia group ltd | retail | United Kingdom | 233 | +40 | 20.7% | 98.6 |
| conga | IT services | United States | 376 | +41 | 12.2% | 98.3 |
This is a simplified preview. Full datasets include additional signals, fields, and filtering capabilities.
Buyer-specific samples on request
Audience
Built For
Go to market teams building account level targeting and outbound lists
Private equity and venture teams screening for growth signals across deal flow
Strategy and corporate development teams monitoring competitor trajectories
Data teams enriching CRM or BI platforms with workforce level signals
Samples
Sample Intelligence Dataset
These samples represent the dataset in its interpretation-ready form, including growth signals, workforce composition, and capability layers. Structured for immediate analytical use and AI workflows requiring temporal company-level data.
Growth Intelligence — Free Sample
Analysis-ready extract
Structured company-year growth signals with percentile-based indicators
Exploration
Interactive Exploration
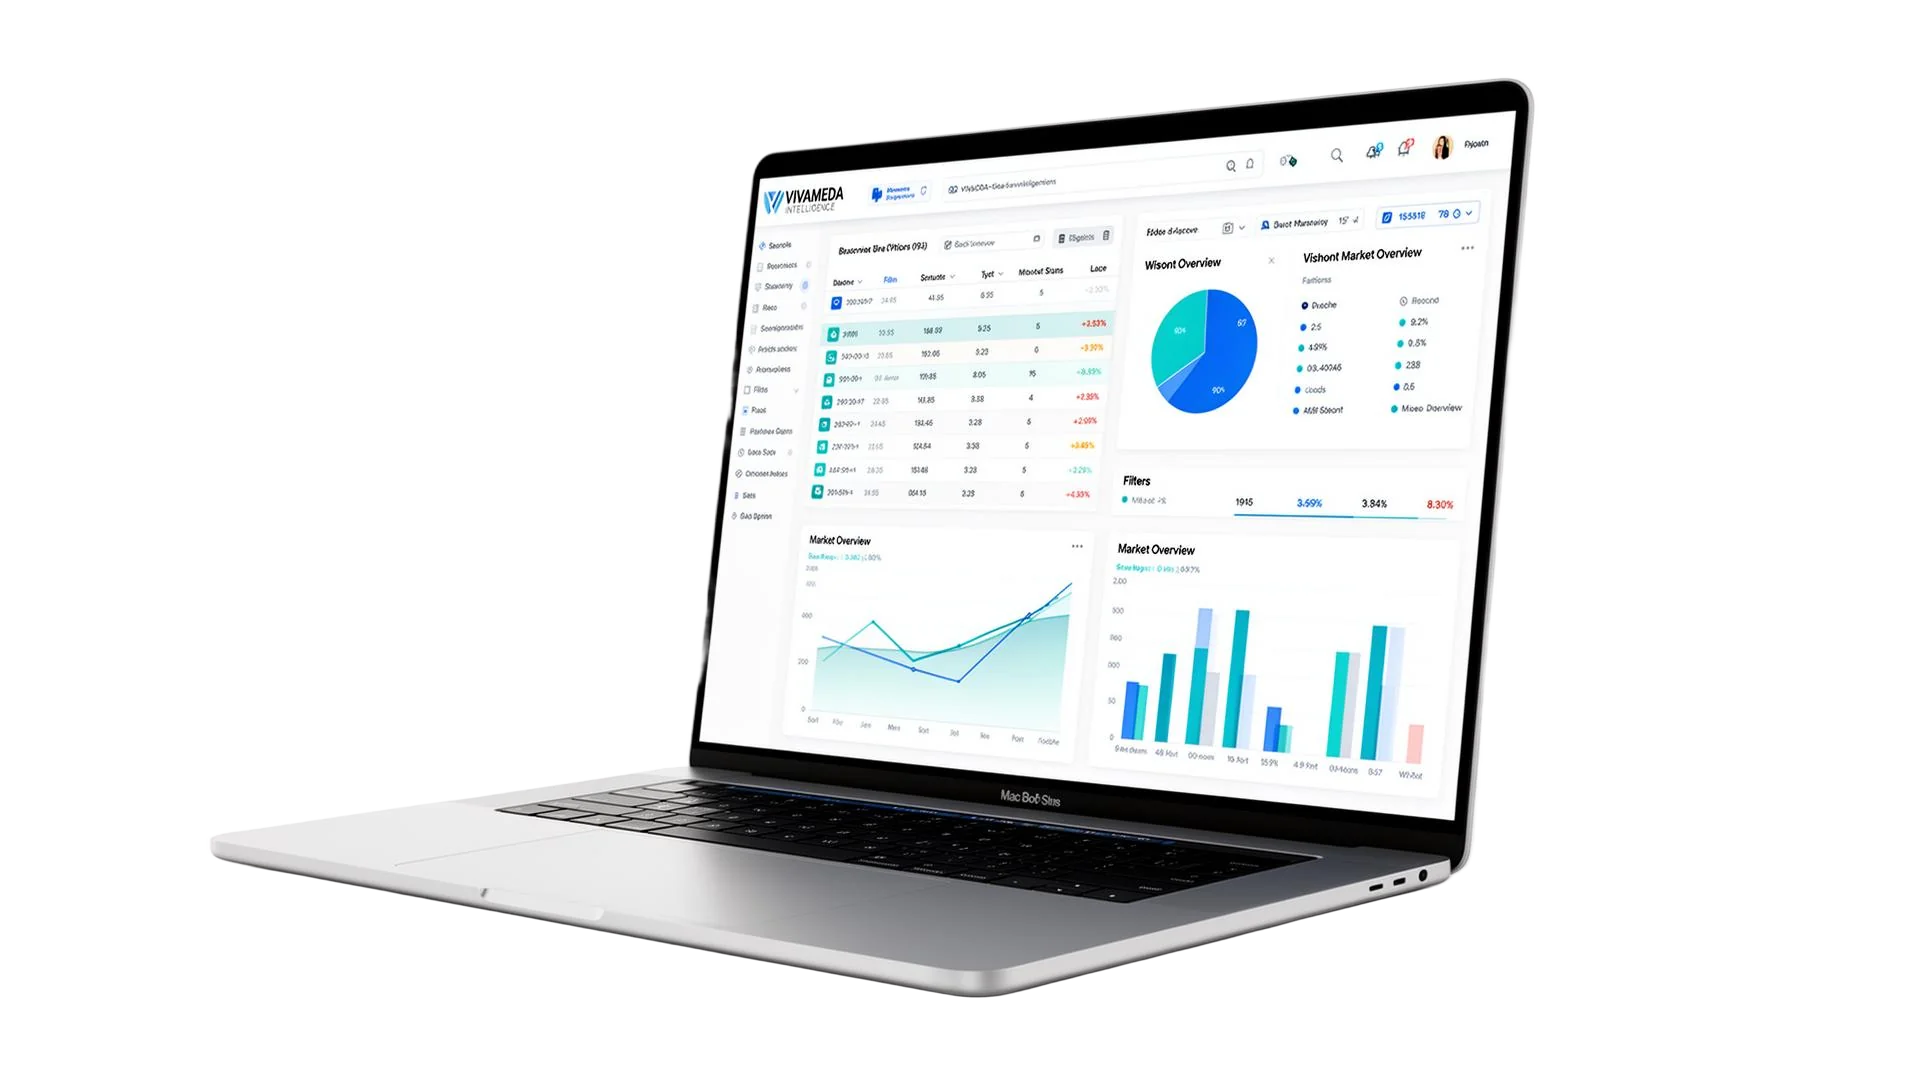
The intelligence can be explored through a dedicated interface, allowing you to filter, segment, and analyze company-level data across time periods.
This provides a more intuitive way to work with temporal company-year data beyond static files, especially for deeper analysis and validation.
Get Started
Schedule a call to discuss how this intelligence fits your workflow.
Book a Vivameda Intelligence Demo