Market Intelligence
Two companies can grow at the same rate and still be fundamentally different businesses. This dataset shows you the difference: how a company's workforce is actually organized and how that structure evolves over time.
Understand how companies actually operate internally over time, not just how they appear from the outside at a single point.
Segment markets by multi-year workforce structure, not just firmographics. Know whether a company is engineering led, sales driven, or operations heavy, and how that has shifted over time.
Foundation
Data Scale
~23.5M
Company-year records
24
Structured columns
4.2M
Companies tracked
2000–2020
Time range
US+
Primary coverage
Built-in
Role diversity & shifts
Observed data gets enriched with current headcount, skills, capabilities, and financial information
Overview
What It Is
The dominant function inside each company (engineering, sales, operations, specialist, or other) and how large that function is relative to the whole, tracked across longitudinal company-year observations. The dataset focuses on the 2000–2020 period, where company coverage and signal density are highest.
How diversified or concentrated a company's role mix is over time, revealing whether you are looking at a focused operator or a broad organization and how that profile evolves.
Structural differences between companies that look identical on revenue, headcount, or industry classification alone, made visible through multi-year workforce composition data.
Capabilities
What You Can Do With It
Split a target market into engineering led, sales led, and operations heavy segments and tailor outbound messaging to each
Find structurally similar companies across unrelated industries for TAM expansion or comparable analysis
Evaluate acquisition targets on workforce structural alignment rather than surface-level market position
Track when a company shifts its dominant function from one year to the next using multi-year data, which often signals a strategic pivot
Signals
What's Included
All Growth Intelligence signals (headcount, growth, tenure, percentiles)
Primary role bucket and its share of total workforce
Count of distinct role categories per company
Role diversity classification (low, moderate, high)
Role specialization indicator
Dominant function shift detection across years
Directional flags: resilience, high resilience, decline
Format: CSV, Parquet, Snowflake, or RAG file. Company-year level. Same cohort as Growth Intelligence with additional structural fields. Drop-in replacement for the Growth layer with deeper resolution.
Preview
Dataset Preview
A representative sample of company-year signals from the dataset. Production versions include additional fields, temporal depth, and filtering capabilities.
| Company | Industry | Country | Headcount | Growth % | Primary Function | % of Workforce | Org Diversity |
|---|---|---|---|---|---|---|---|
| equitable | real estate | United States | 697 | 84.9% | Sales | 42% | High |
| blue yonder gmbh | IT services | Germany | 373 | 59.4% | Engineering | 38% | High |
| brex | financial services | United States | 281 | 41.2% | Engineering | 44% | High |
| celonis | IT services | Germany | 201 | 30.5% | Engineering | 41% | High |
| arcadia group ltd | retail | United Kingdom | 233 | 20.7% | Operations | 36% | High |
| conga | IT services | United States | 376 | 12.2% | Sales | 39% | High |
| bankers healthcare grp | financial services | United States | 408 | 9.4% | Sales | 35% | High |
This is a simplified preview. Full datasets include additional signals, fields, and filtering capabilities.
Buyer-specific samples on request
Audience
Built For
Market research teams building segmentation beyond industry and revenue brackets
Competitive intelligence teams benchmarking how rivals allocate workforce
Sales strategy leads designing ICP models around organizational shape
M and A teams assessing structural compatibility before deeper diligence
Samples
Sample Intelligence Dataset
These samples represent the dataset in its interpretation-ready form, including growth signals, workforce composition, and capability layers. Structured for immediate analytical use and AI workflows requiring temporal company-level data.
Market Intelligence — Free Sample
Analysis-ready extract
Workforce composition and role distribution aligned to company structure
Exploration
Interactive Exploration
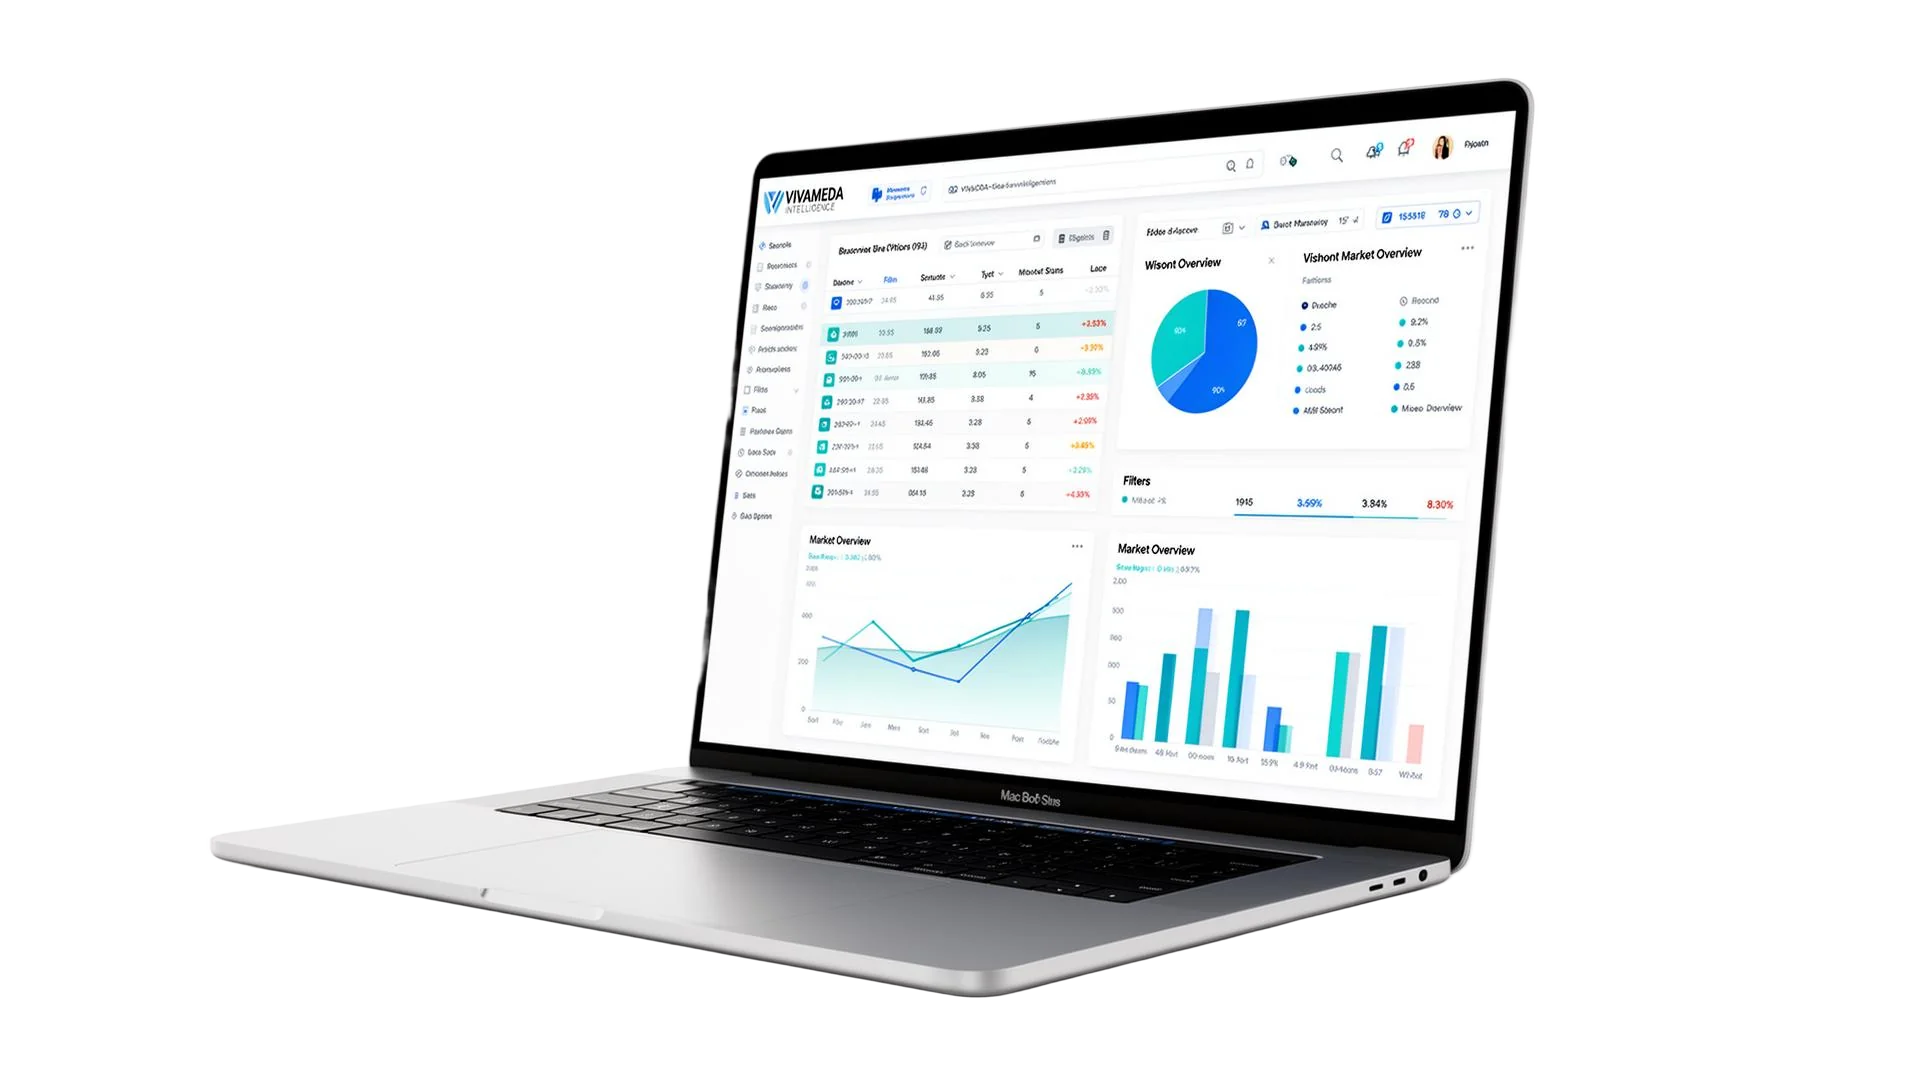
The intelligence can be explored through a dedicated interface, allowing you to filter, segment, and analyze company-level data across time periods.
This provides a more intuitive way to work with temporal company-year data beyond static files, especially for deeper analysis and validation.
Get Started
Schedule a call to discuss how this intelligence fits your workflow.
Book a Vivameda Intelligence Demo